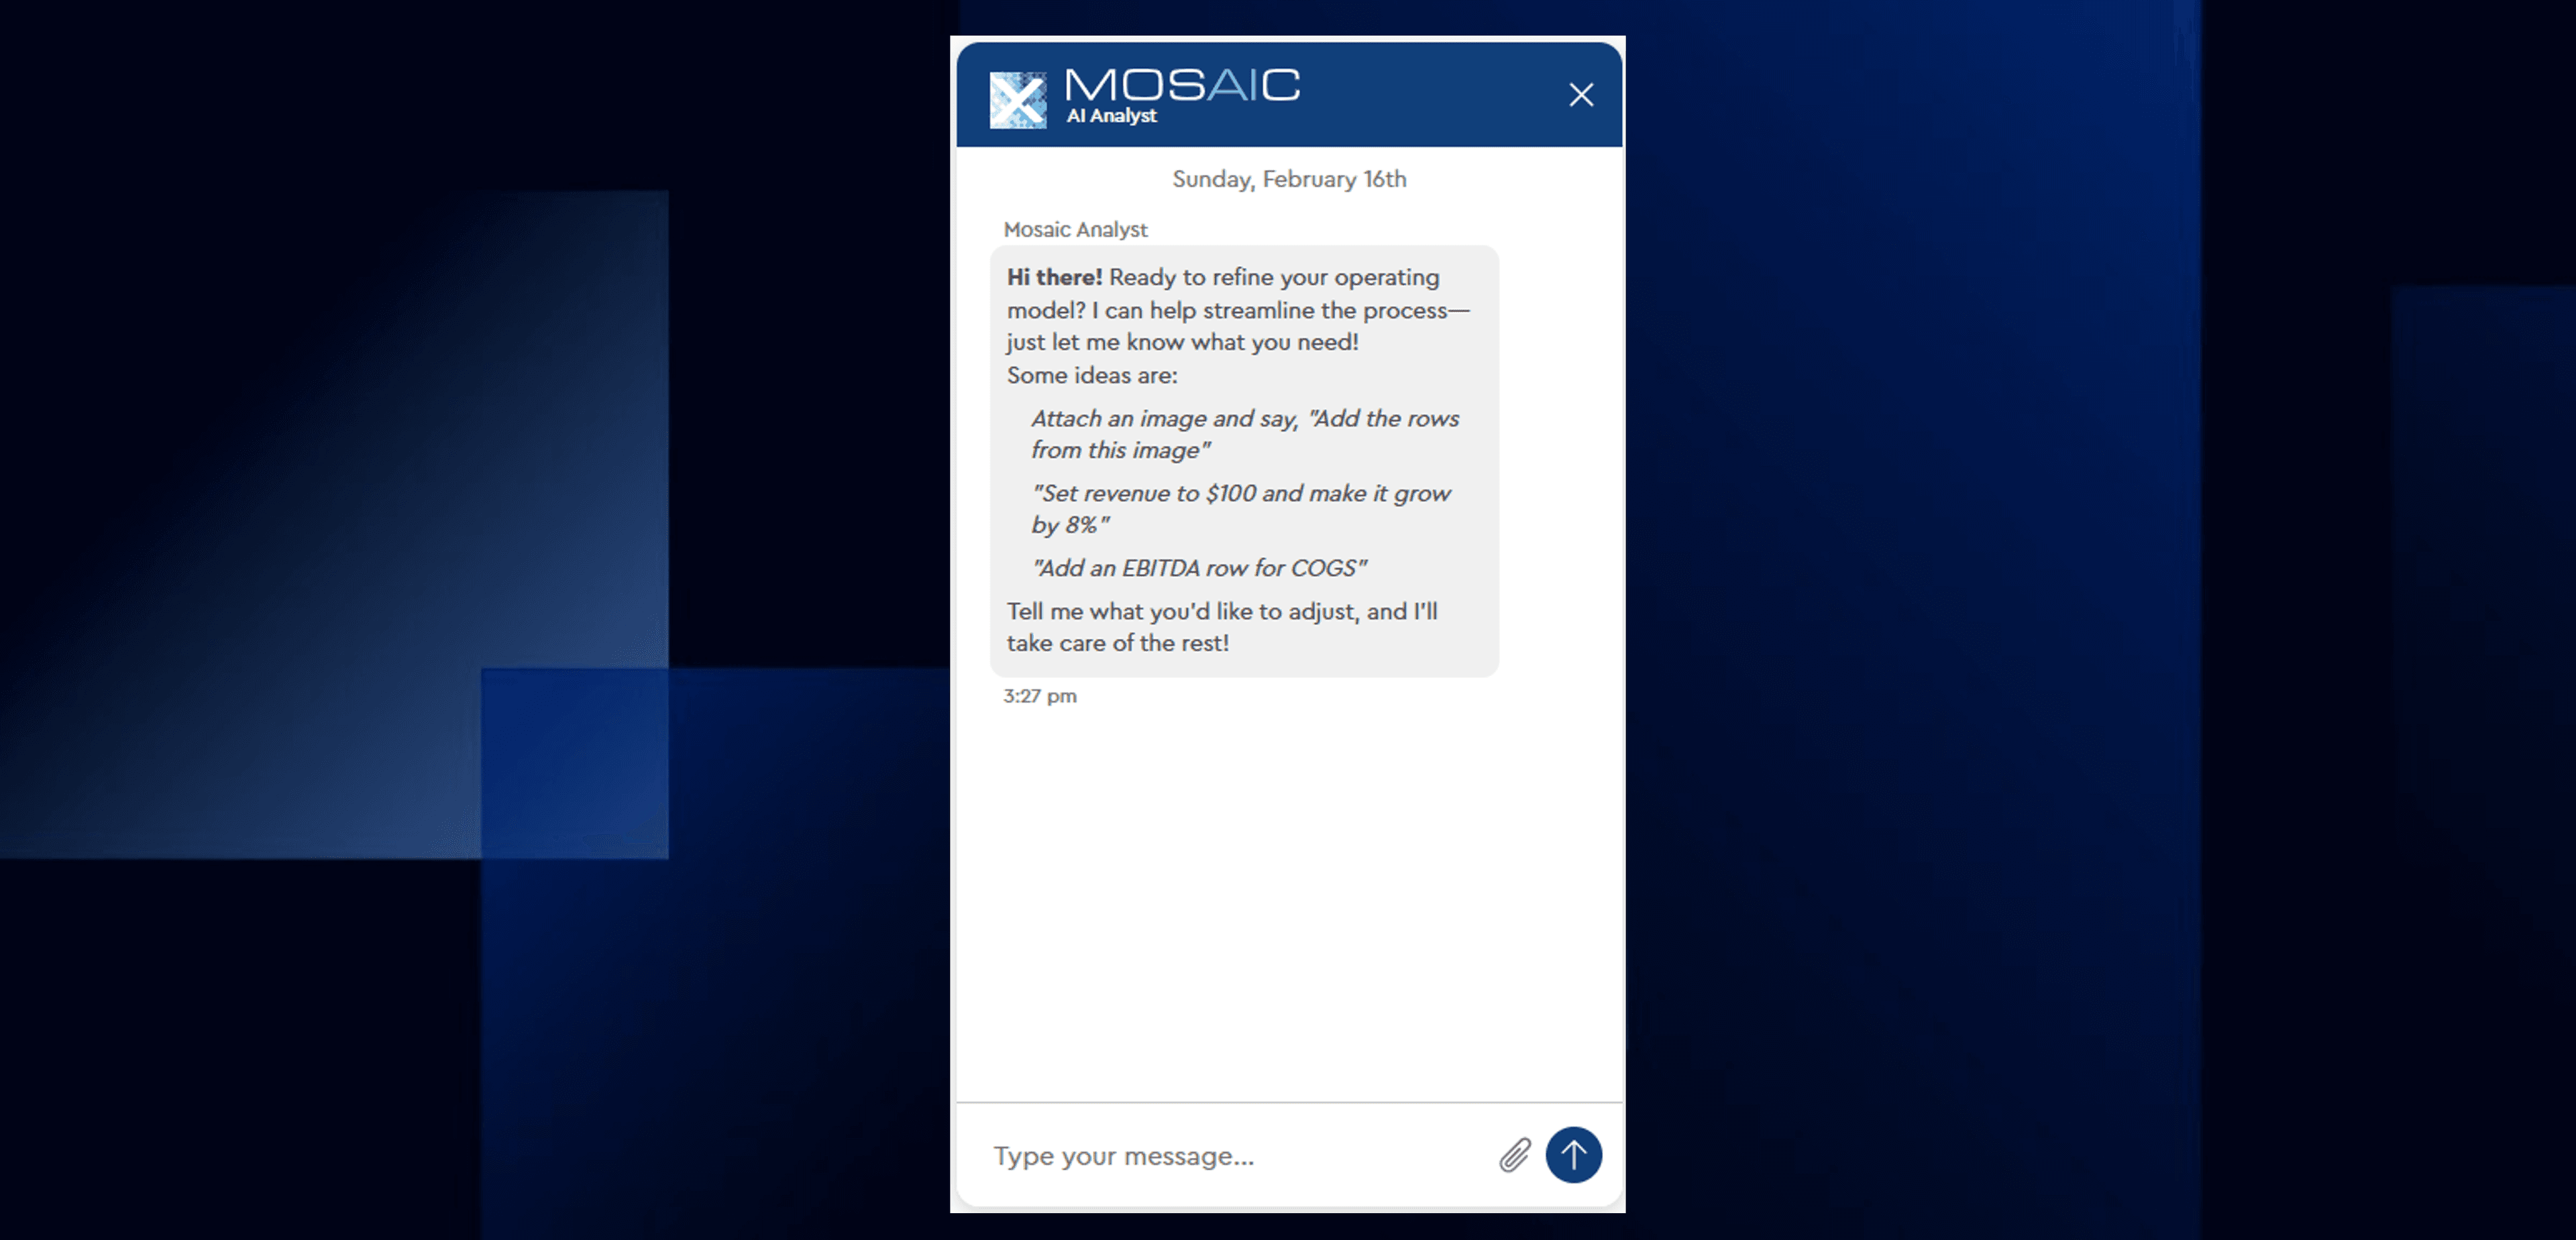
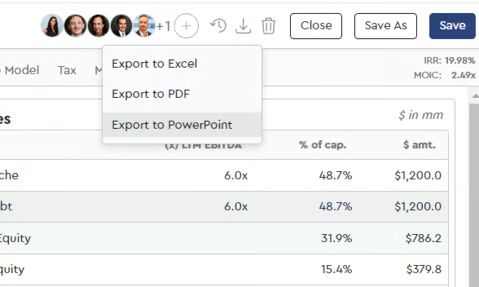
Enhanced AI Analyst Chat Experience
Mosaic’s latest update to the AI Analyst chat delivers several enhancements designed to improve usability and performance. Users can now upload and analyze both PDF and Excel files directly within the chat, enabling additional supporting files to be uploaded to support a single operating model.
Responses are also now better formatted for improved readability, and overall instruction following has been enhanced to deliver more accurate, reliable, and context-aware outputs.
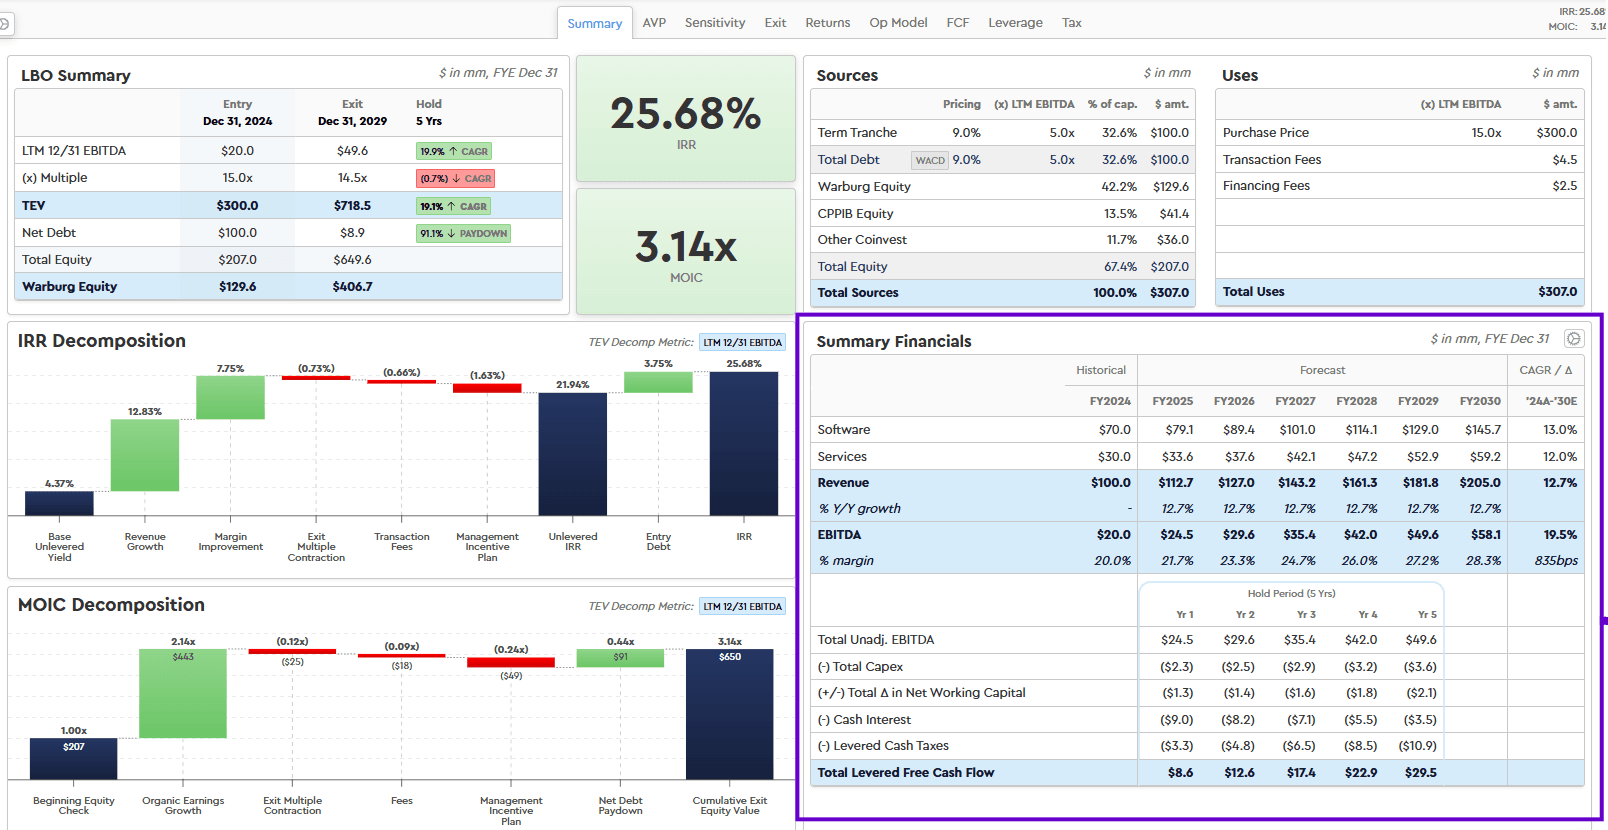
Capitalization Table in Credit Mode
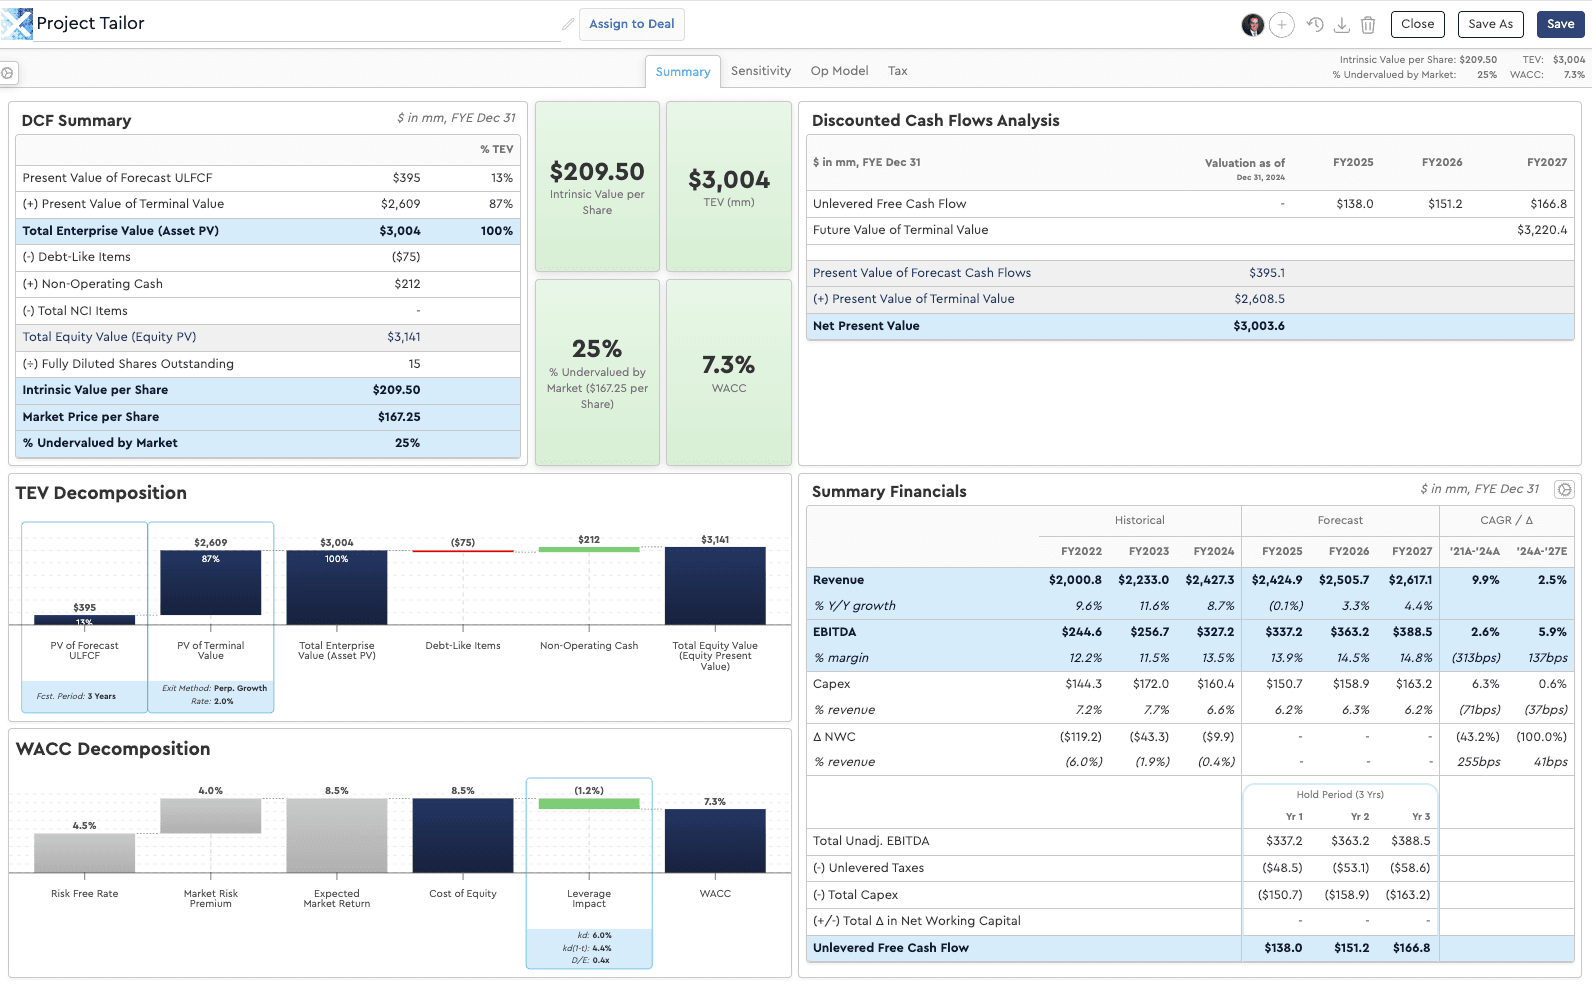
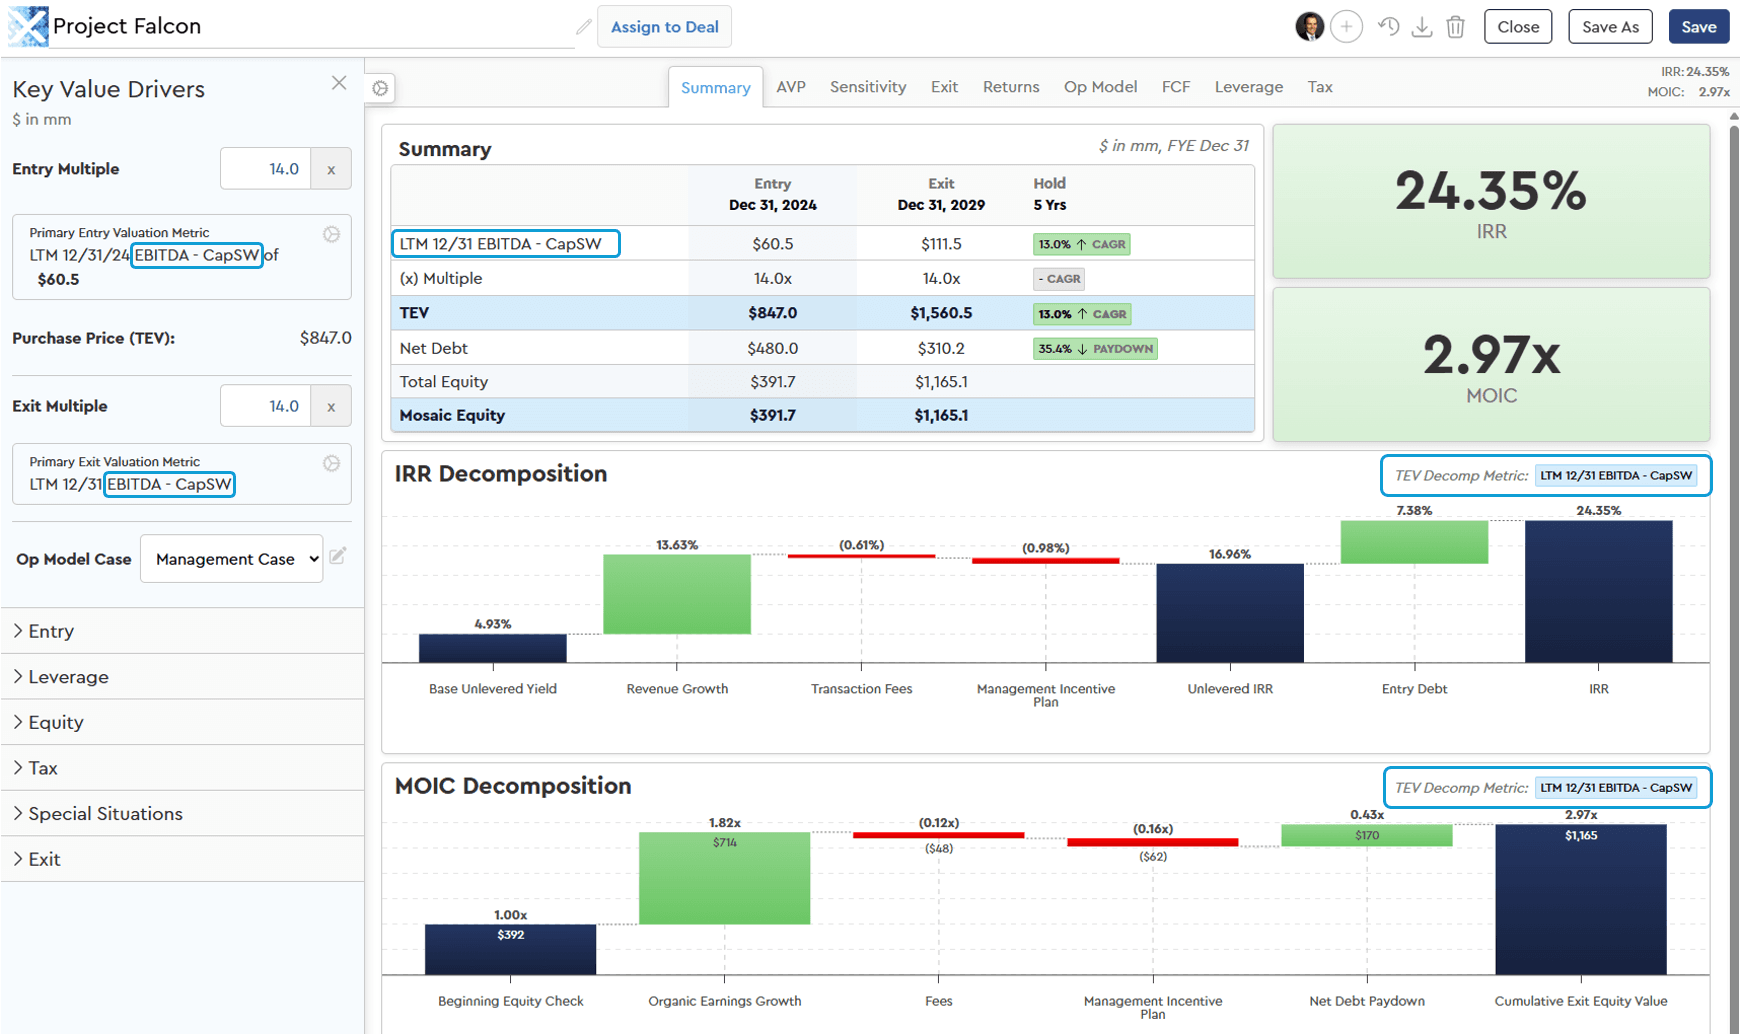
In Mosaic’s Credit Investor view, accessible via the gear icon in the top-right corner of any completed model, a capitalization table is now available on the “Summary” tab. The table includes all debt tranches, along with associated sizing, pricing, and fees, as well as equity investors, providing a single, comprehensive view of an investment’s full capital structure.
Note that the “Credit Investor” view can also be set as the default investor type under “LBO View” in profile defaults.
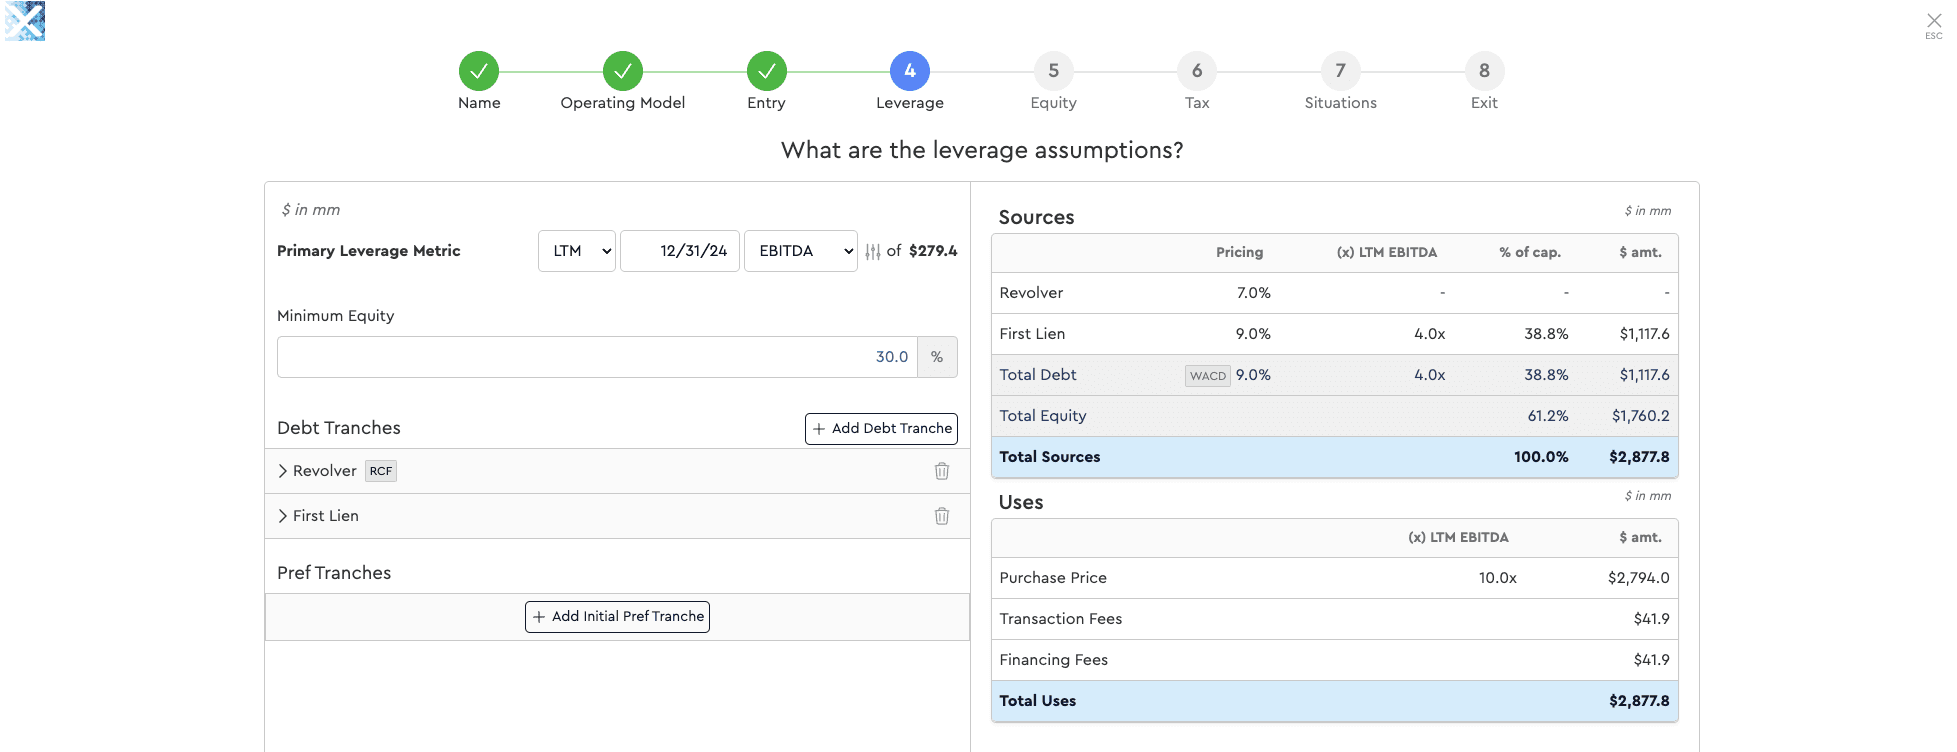
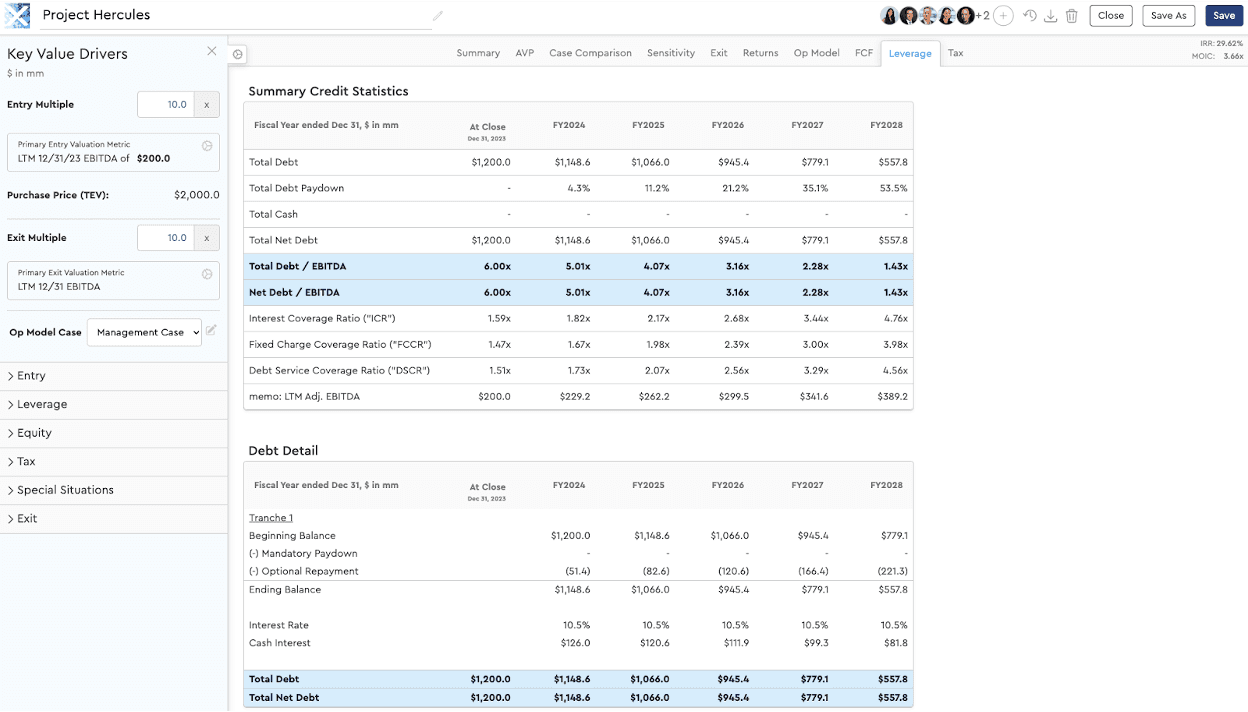
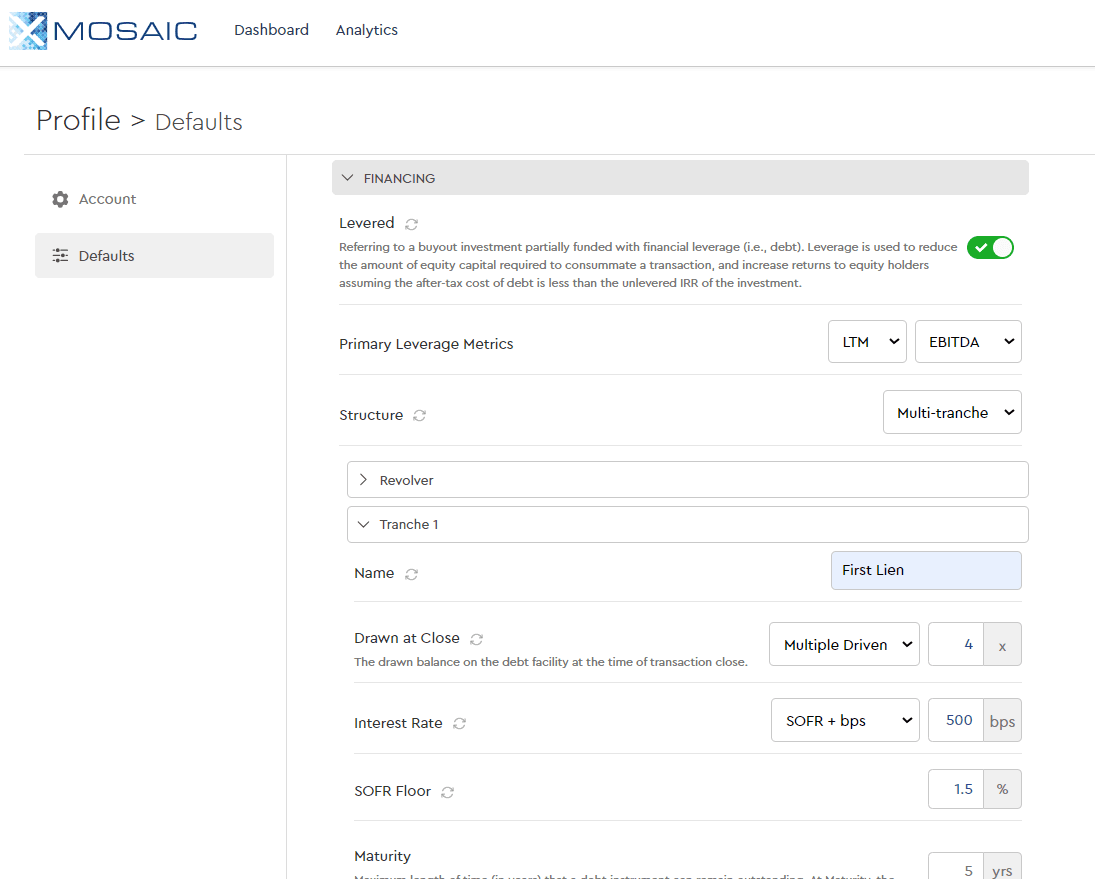
Grouped Debt Tranches by Lien Type
Mosaic now supports grouped debt tranches by lien type, allowing users to sensitize entry leverage on a grouped tranche basis, including all first lien or all second lien debt. Note that multiple debt tranches can be categorized as either First Lien on Second Lien by selecting the dropdown menu at the bottom of each tranche in the wizard or within the “Key Value Drivers” panel in a completed model.
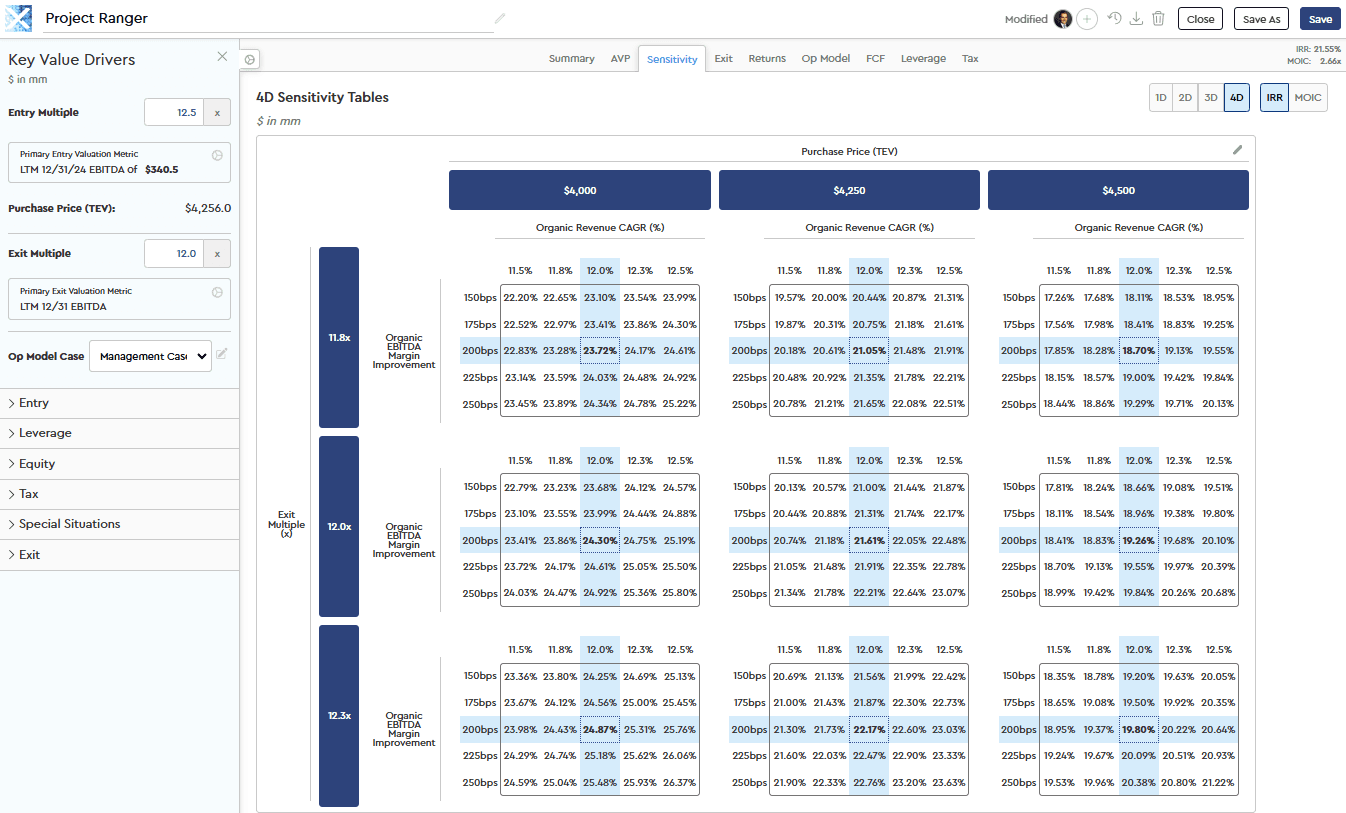
To sensitize grouped debt tranches by lien type, navigate to the “Sensitivity” tab and select the “+” button to create a new table. Next, select one or more metrics to sensitize, and then click either the X or Y axis to sensitize Entry Leverage against a second deal assumption or line item. Note that an option to select a “Tranche” will appear directly below the X or Y axis dropdown menu.
Sensitize Leverage Tranche Interest Rates
Mosaic now supports sensitivity analysis for leverage tranche interest rates within the “Sensitivity” tab. To sensitize interest rates, create a new sensitivity table and use the X- or Y-axis dropdown to select “Leverage Tranche Interest Rate”, then choose your desired tranche.
Autopilot Now Delivers Excel Model via Email
Users prompting Mosaic’s agentic workflow, Autopilot, via email can now receive a completed Excel model alongside the PDF output—removing the need to export files directly from the platform.
Need to make changes? Simply reply to the email with updates and receive a revised Excel model within minutes, or use the included link to access and edit the model directly within Mosaic.
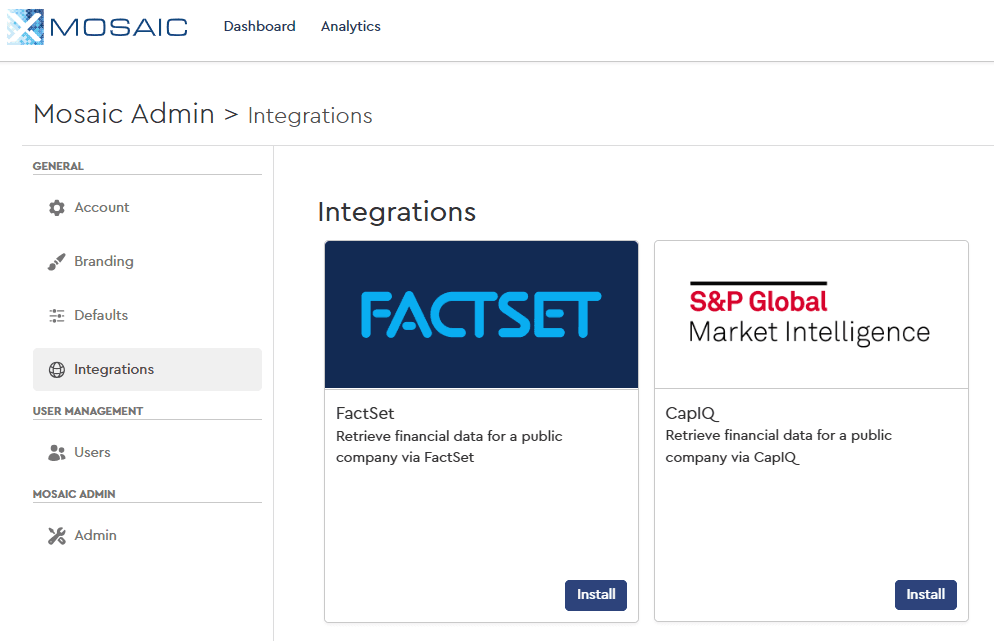
FactSet Integration Update
Firms using Mosaic’s FactSet integration to model public companies can now automatically populate current share price, historical share price, broker targets, and additional market data into AVP outputs—capabilities previously available only through the Cap IQ integration.
VWAP Now Available in AVP Outputs for Take-Private Analysis
Firms leveraging both Mosaic’s Cap IQ and FactSet integrations can now import volume-weighted average price (VWAP) directly into AVP outputs when modeling public companies. Users can seamlessly incorporate both % Premium to L3M VWAP and % Premium to L6M VWAP into their analyses. Each VWAP line item can be toggled on or off, giving teams added flexibility to customize outputs directly within the Mosaic platform.
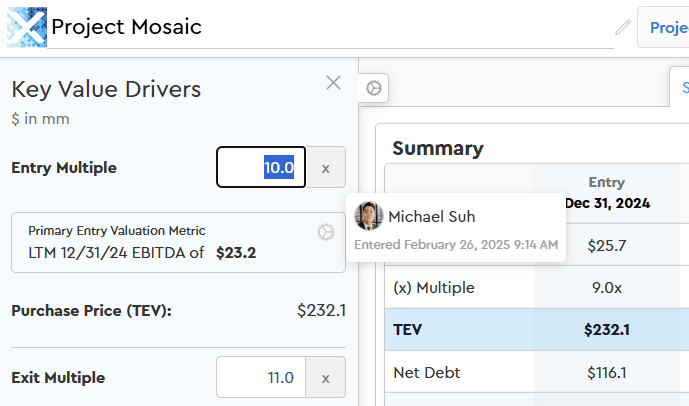
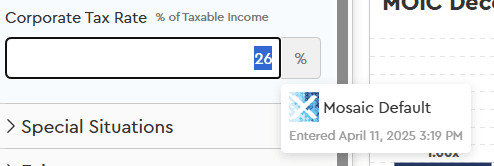
Direct Arithmetic in Input Cells
Mosaic now supports direct arithmetic in input cells across the platform, making side calculations and formula entry faster and more intuitive. For example, to calculate a 10% management co-investment on a total TEV of $1,000, users can simply enter 1,000 * 0.1 directly into the input cell. Then to exit the cell and run the calculation, either hit “Tab” or click anywhere outside the cell.
This functionality is available across all input cells within the Key Value Drivers panel and operating model.
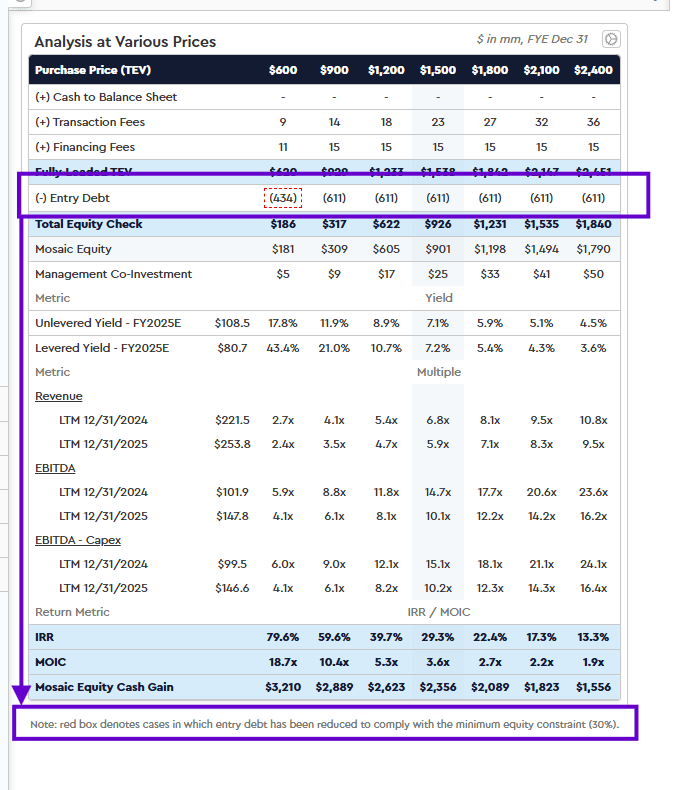
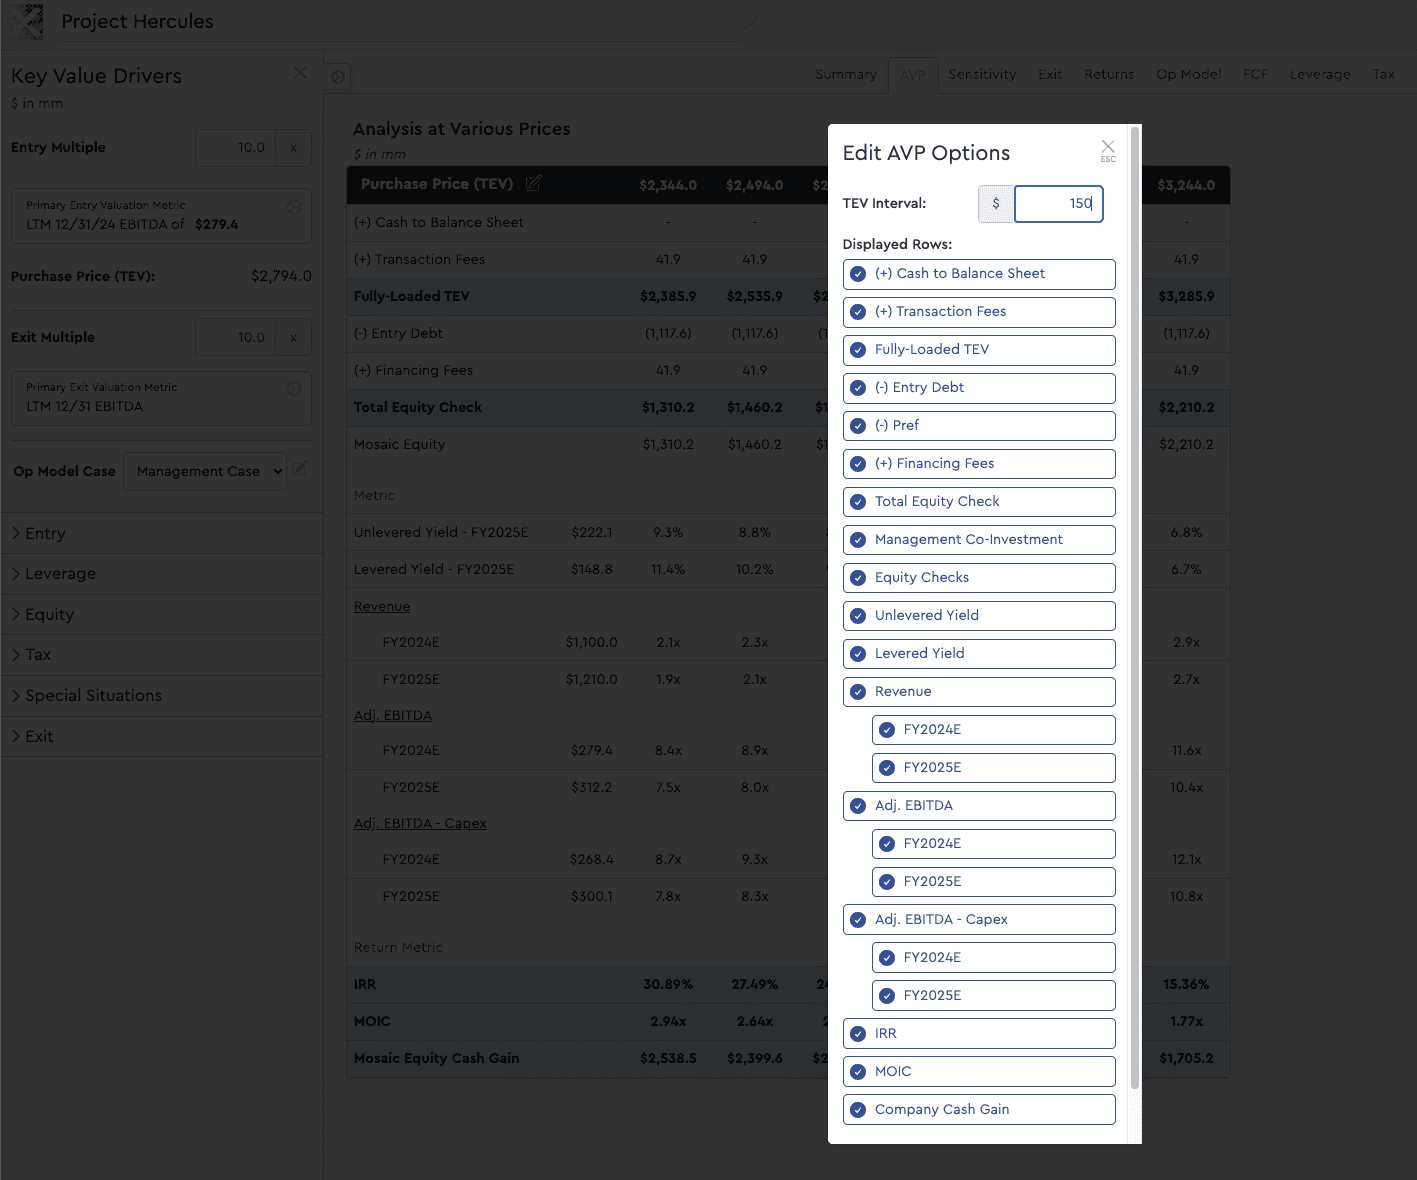
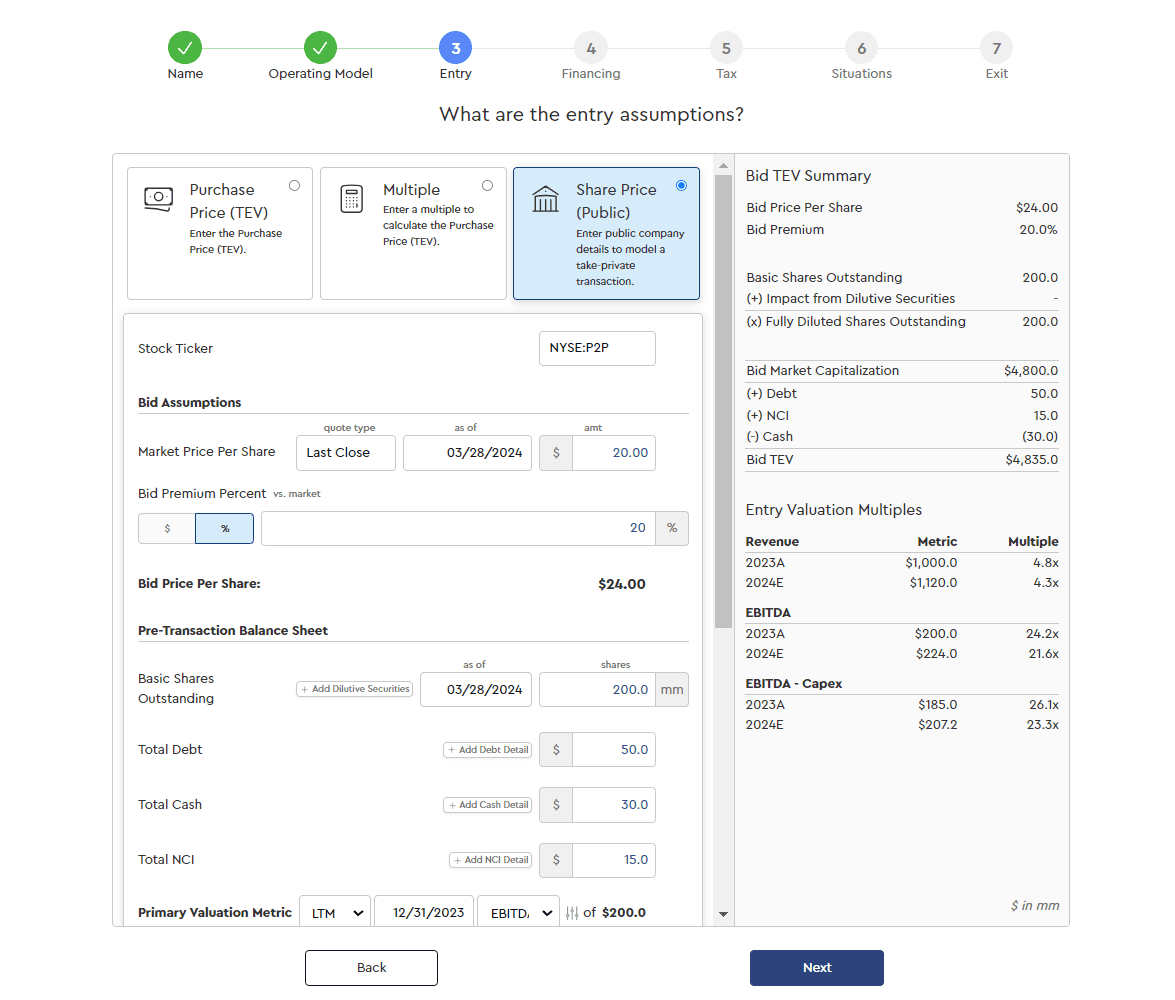
Set Defaults for Analysis at Various Prices “AVP” Output Display Rows
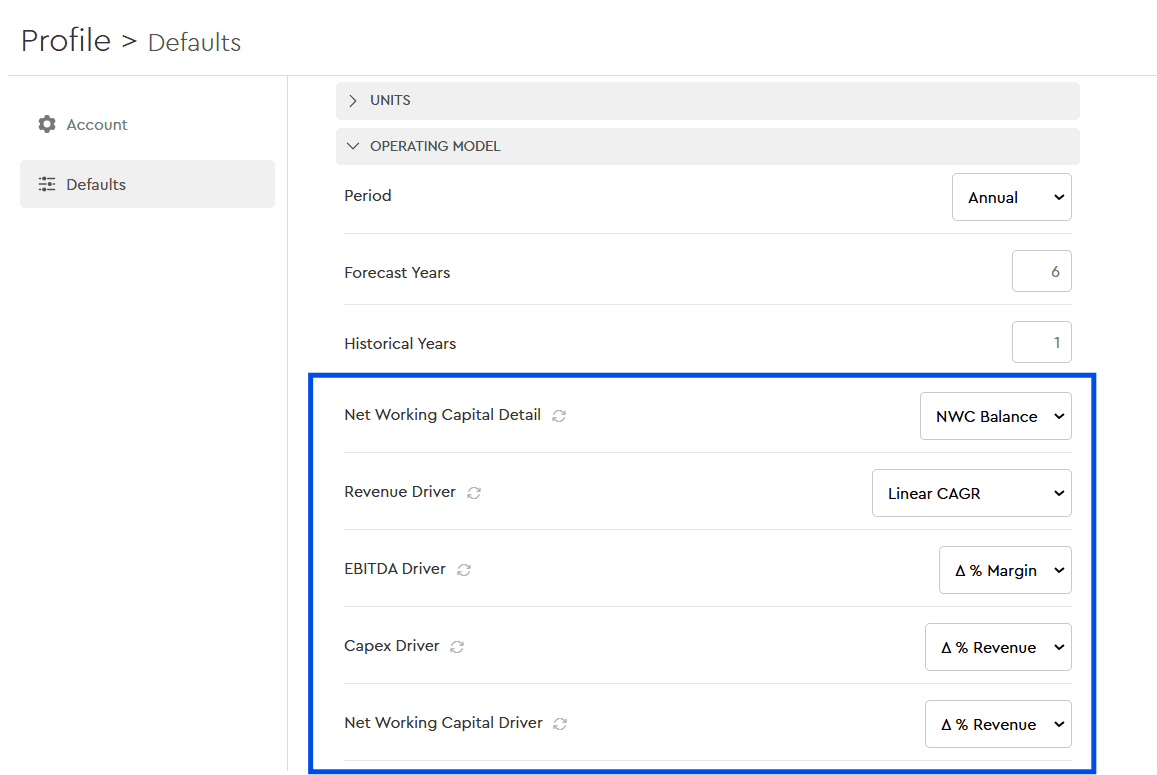
Additional profile default functionality now allows users to customize the display rows shown in the AVP output across completed models. To update these defaults, navigate to the profile defaults section of the platform by clicking the dropdown next to the user name on the homepage and selecting “Defaults”.
Under the “AVP” dropdown, users can now customize AVP line items, including the AVP driver (“Bid Price per Share” or “Bid Premium”), column count, multiple calculation convention, and displayed rows. These settings make it easier to tailor the output format to individual firm preference and automatically apply those settings across all subsequent models.
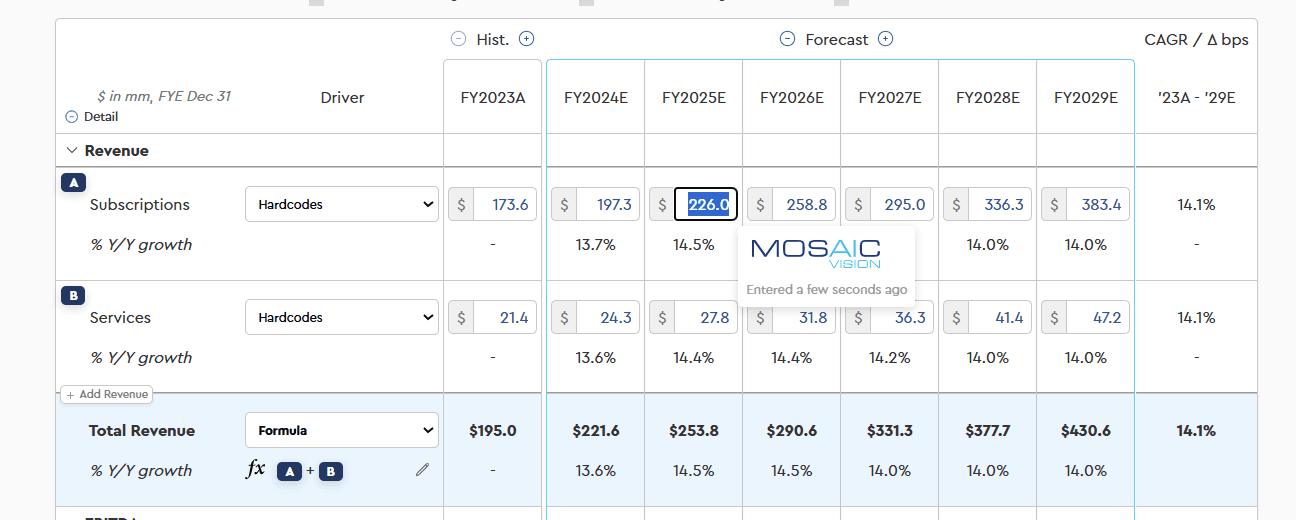
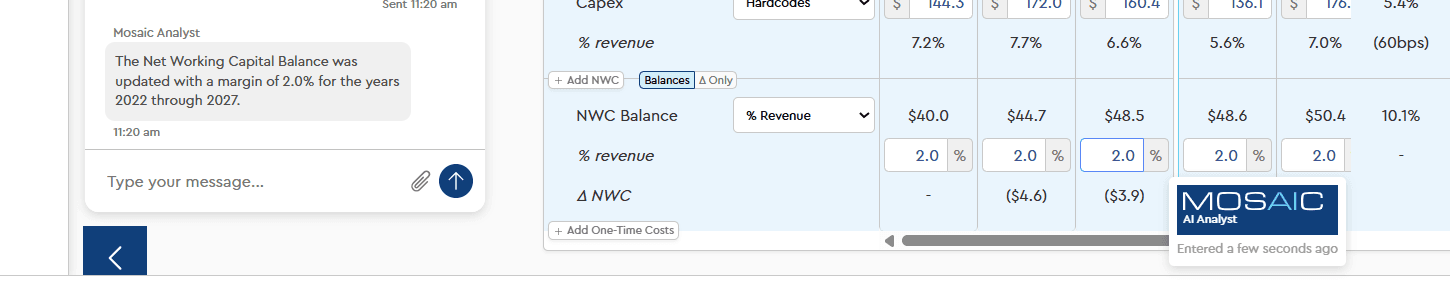
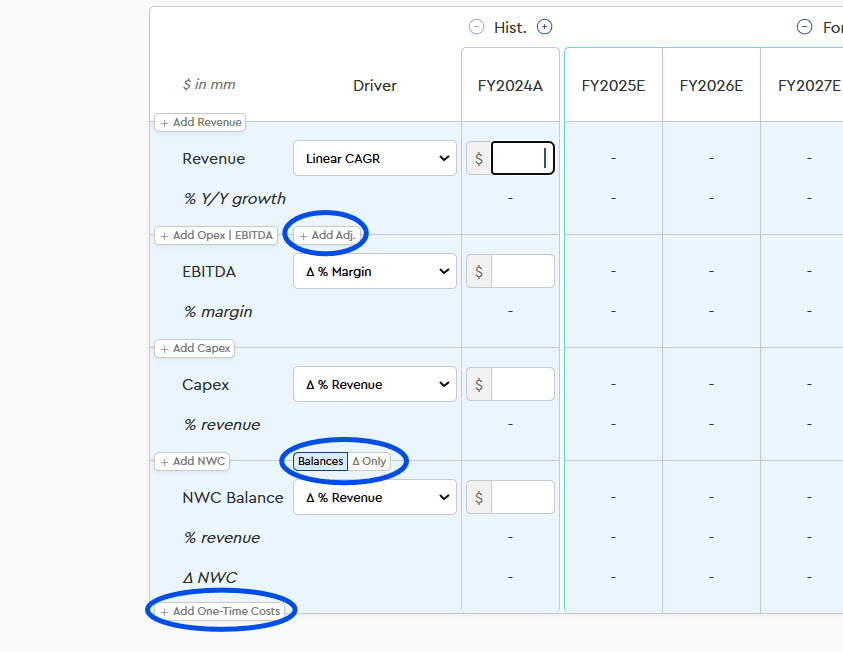
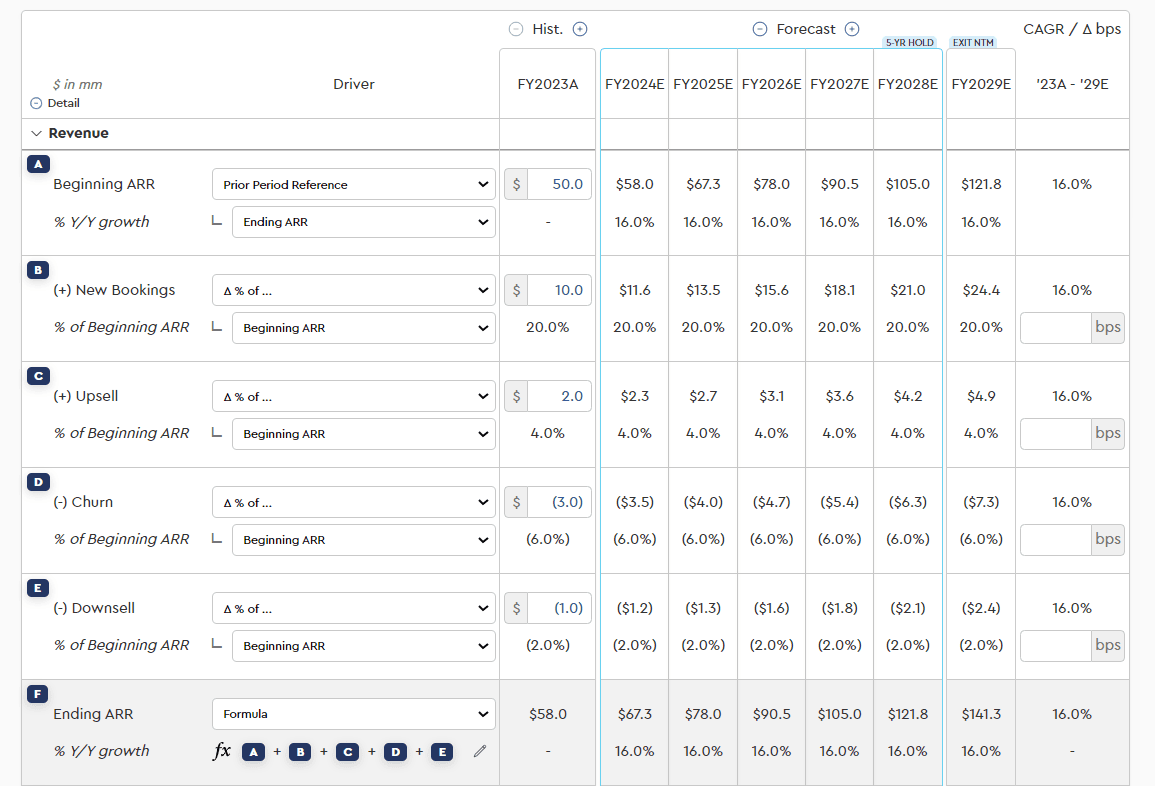
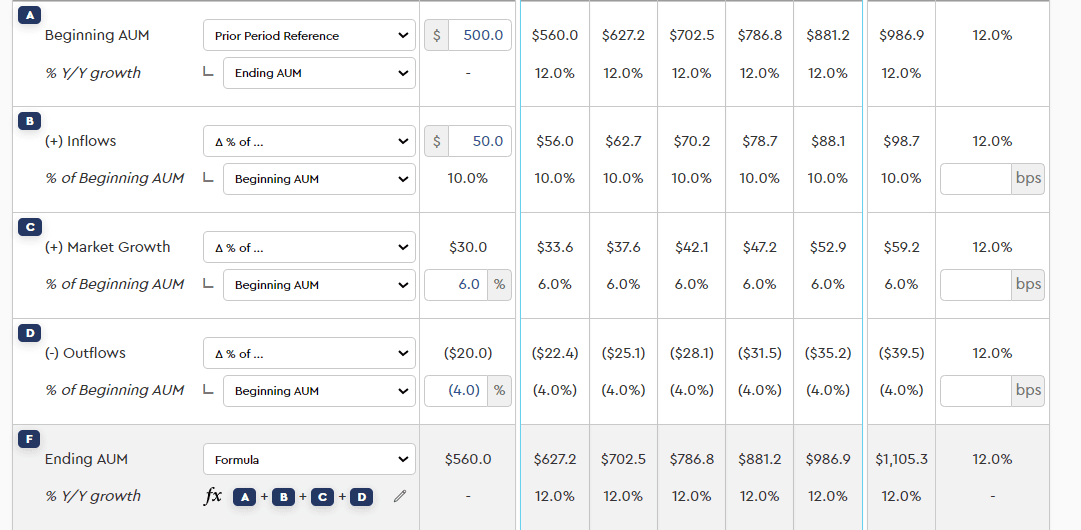
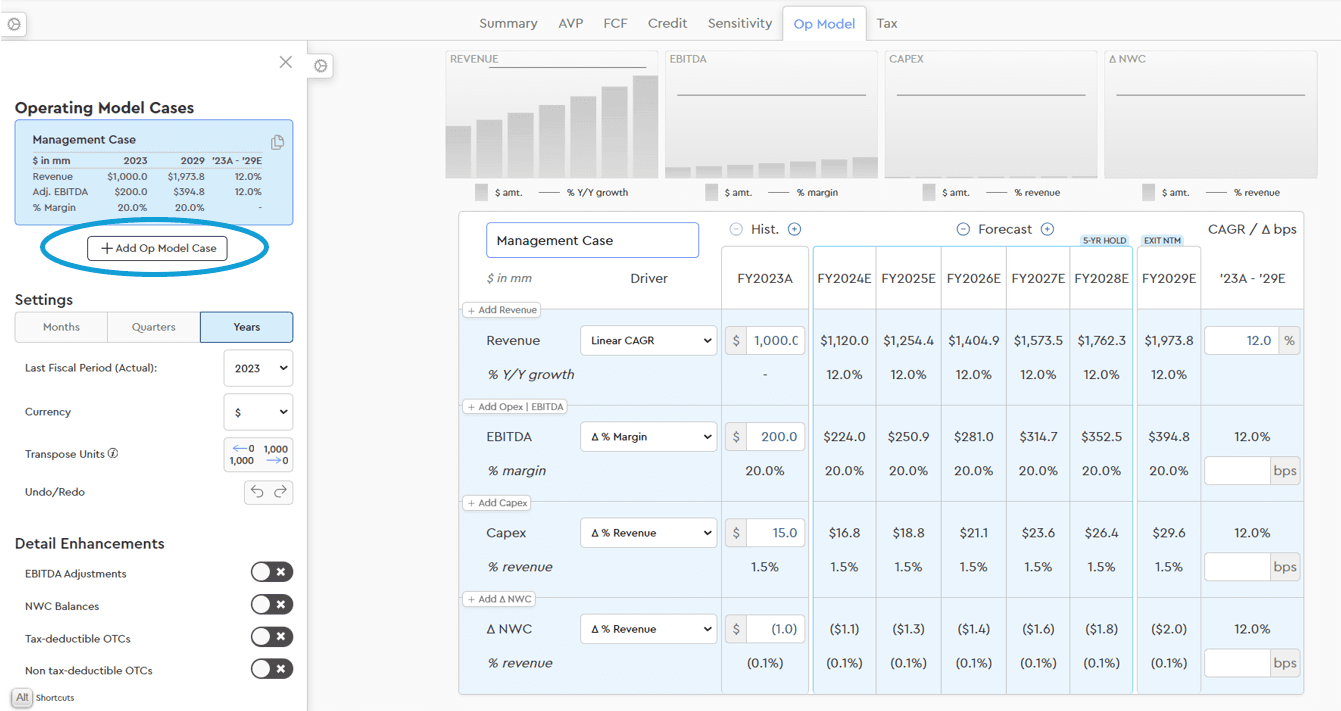
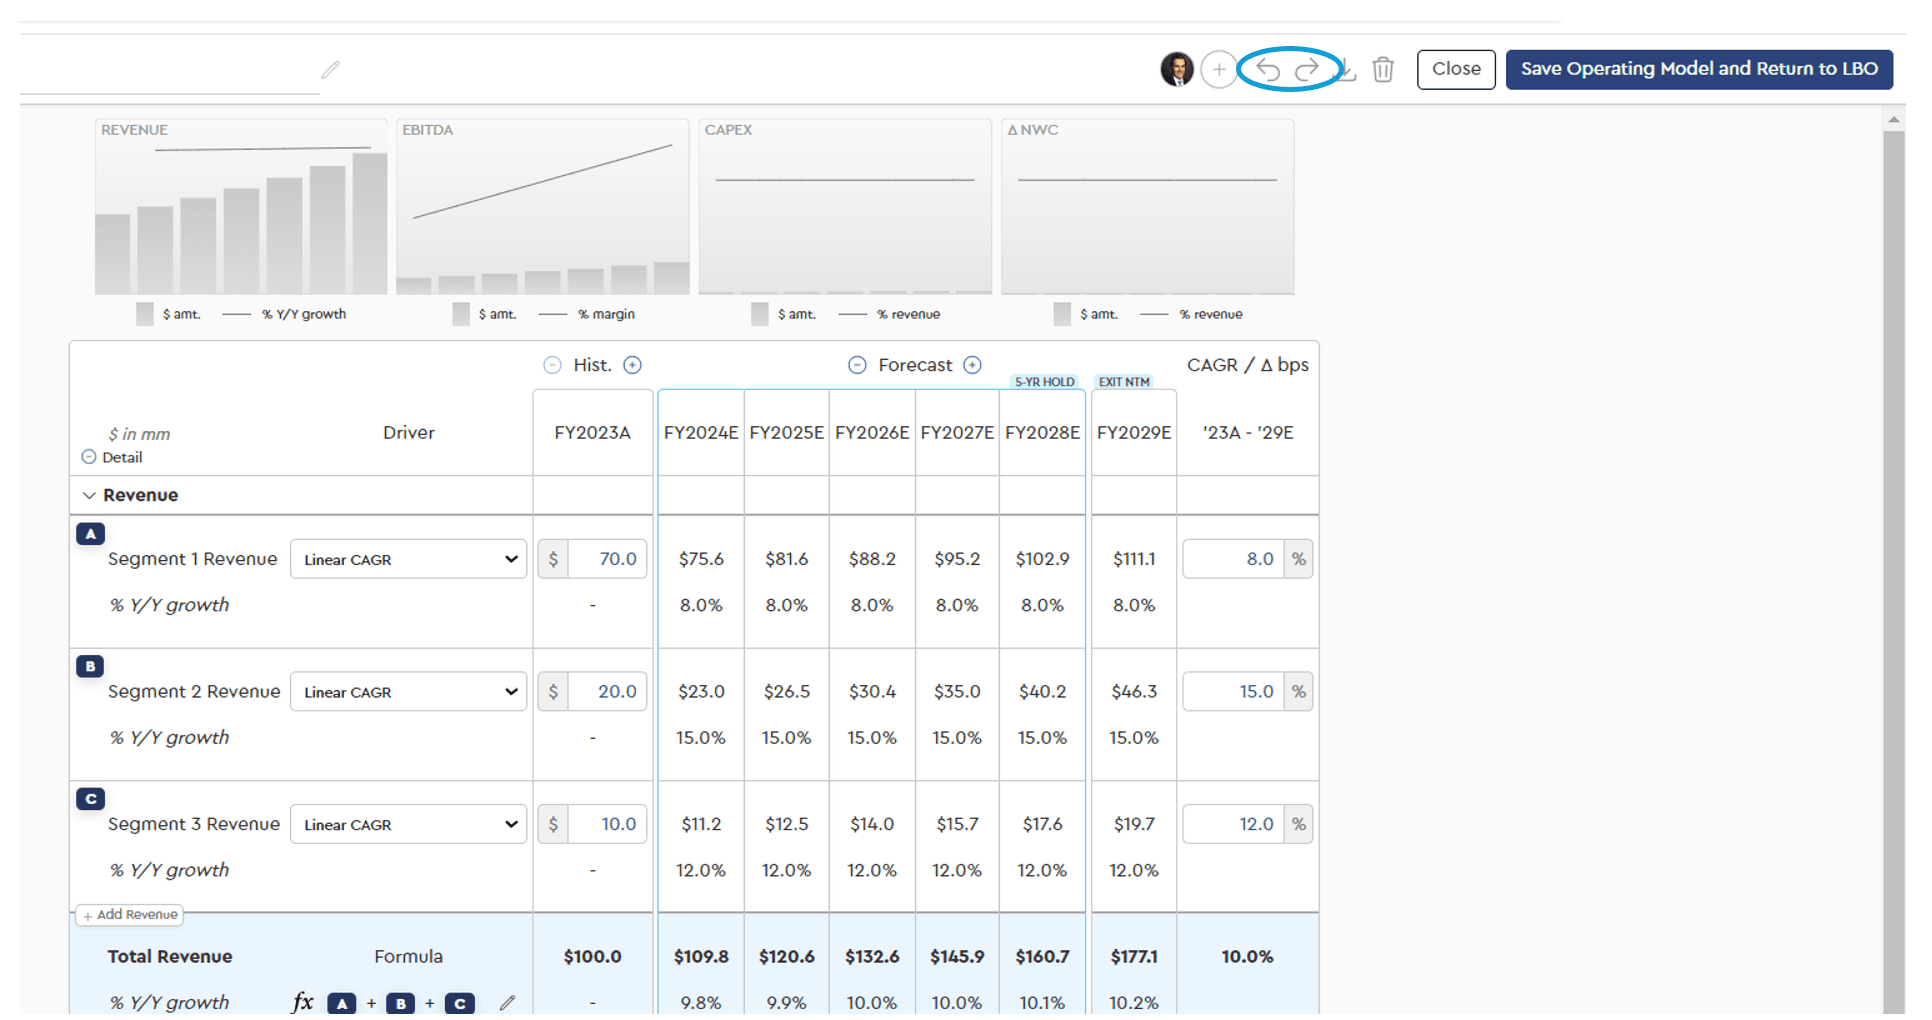
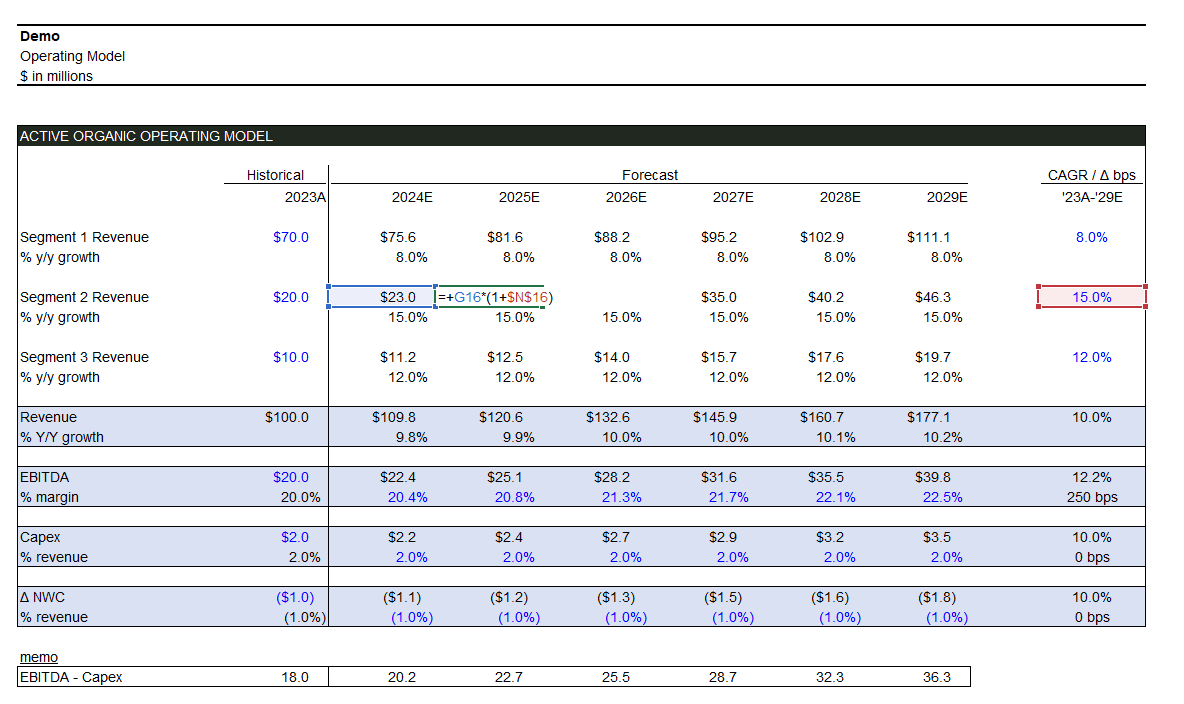
New Swag and Build Categories for Mosaic’s Operating Model Drivers
When selecting a driver in a Mosaic operating model, options are organized into two categories: Swag and Build. As the name suggests, Swag options provide quick ways to generate a forecast, using either a linear CAGR or a margin flex by a certain amount of basis points.
In contrast, the Build category offers more granular control. Users can define growth rates or margins by year, apply hardcoded values, use formulas, or reference prior periods.
Mosaic’s operating model supports both quick estimates and fully customized forecasting—giving you the flexibility to model as simply or detailed as you’d like.
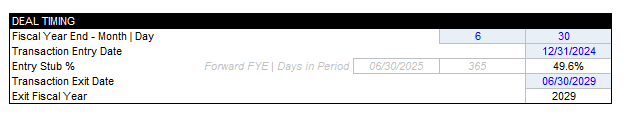
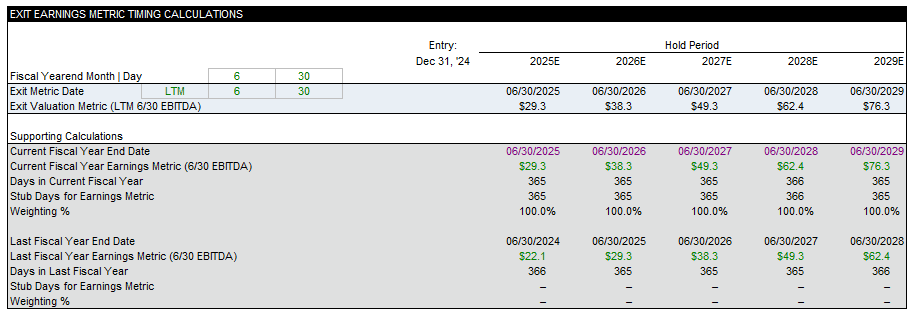
Automated Fiscal Year End Imports for Public Companies
Mosaic now automatically imports fiscal year end dates directly from Cap IQ or FactSet for public companies when the applicable data plug-in is enabled. This enhancement reduces manual data entry and helps ensure financial reporting periods are aligned with the latest available market data.